Claude Code Now Exposes Rate Limit Usage in the Status Line, So I Built a Script to Show It
by 逆瀬川ちゃん
7 min read
Hi there! This is Sakasegawa (@gyakuse)!
Claude Code v2.1.80 finally added the long-awaited rate_limits field for status lines. People had been jumping through hoops to get this for so long. It was a rough world out there.
What changed
The v2.1.80 release on March 19, 2026 added a rate_limits field to the JSON passed to status line scripts.
Here's what the changelog says:
Added rate_limits field to statusline scripts for displaying Claude.ai rate limit usage (5-hour and 7-day windows with used_percentage and resets_at)
With this, you can now show Claude Code's subscription usage (both the 5-hour window and the 7-day window) in your status line in real time.
How it works
The Claude Code status line works in a simple way.
- Claude Code passes session info as JSON on the script's stdin
- The script extracts the fields it needs and formats them
- Whatever the script prints to stdout shows up in the status bar
The newly added rate_limits field looks like this.
{
"rate_limits": {
"five_hour": {
"used_percentage": 42.3,
"resets_at": 1774036800
},
"seven_day": {
"used_percentage": 85.7,
"resets_at": 1774580400
}
}
}
used_percentage is the usage rate and resets_at is the reset time as a Unix timestamp in seconds (the initial version of this post said it was ISO 8601, but it was actually a Unix timestamp — thanks yagrabit for pointing that out!). Combined with the existing context_window.used_percentage, you can see your remaining resources at a glance.
Setup
You can install this by just running Claude Code and asking it to do it for you.
https://nyosegawa.com/posts/claude-code-statusline-rate-limits/ I want to add this. Pattern1
If you want to set it up manually, just add statusLine to ~/.claude/settings.json.
macOS / Linux:
{
"statusLine": {
"type": "command",
"command": "~/.claude/statusline.py"
}
}
Remember to chmod +x the script so it's executable.
Windows:
{
"statusLine": {
"type": "command",
"command": "python ~/.claude/statusline.py"
}
}
On Windows you don't need chmod +x. Instead, run the script through the python command. Claude Code internally uses Git Bash to run commands, so you can use ~ in the path.
Note: Python needs to be installed separately.
Five visual patterns
Since we had the chance, I put together a few patterns. All of them display the same three pieces of information.
- ctx: context window usage
- 5h: 5-hour window usage
- 7d: 7-day window usage
Colors use TrueColor gradients across the board, shifting continuously from green to yellow to red as usage grows.
Pattern 1: Minimal Dots
A minimal style with just colored dots and numbers.
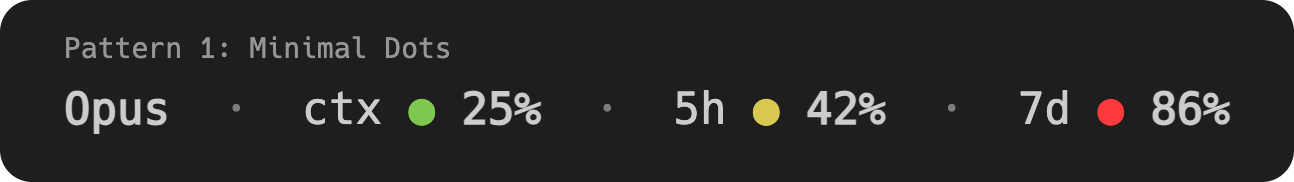
Information density is low but it stays clean and doesn't eat much space in the status bar.
Pattern 2: Sparkline Gauge
A sparkline style using block characters.
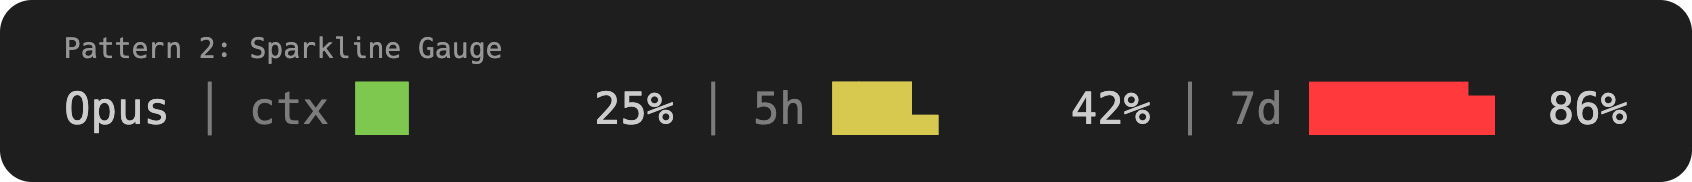
It uses vertical height to represent usage, so the horizontal footprint stays small.
Pattern 3: Ring Meter
A style using pie-chart-like ring icons.
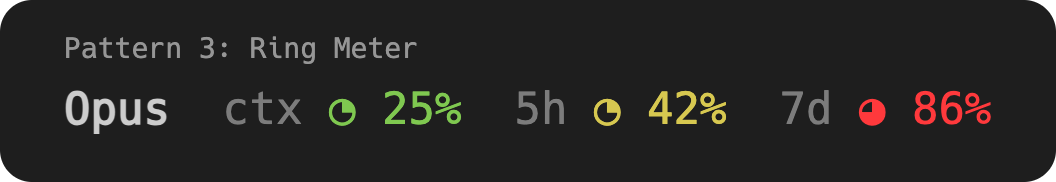
The most compact pattern. The rings only have 5 discrete states but combined with color it's still practical.
Pattern 4: Fine Bar + Gradient
A fine-grained progress bar with 1% precision.

The most information-dense and visually appealing pattern.
Pattern 5: Braille Dots
A dotted style using braille characters.
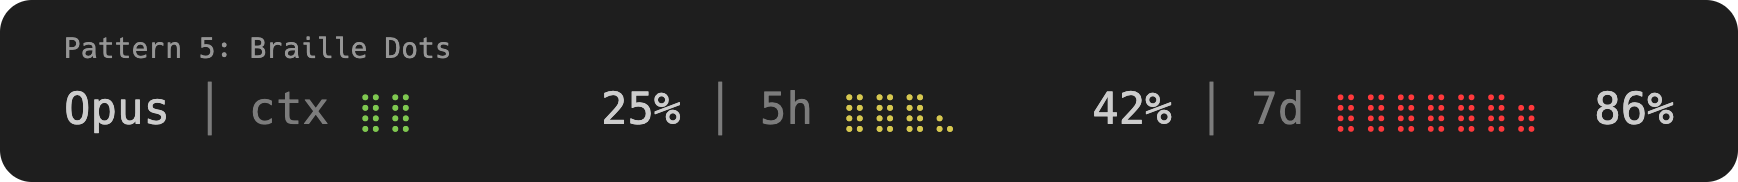
Uses dot density to represent usage. It has a retro vibe that I personally love, and it's the one I use.
Wrap-up
- Claude Code 2.1.80 added the
rate_limitsfield, letting you show 5-hour and 7-day usage in the status line - With ANSI colors and Unicode block characters you can get surprisingly pretty output
- All scripts are in the Appendix ready to paste and use. Pick your favorite pattern
- Claude Code itself can spin up a decent script in no time and let you tweak it while you look at it. Go customize your own status line!
Appendix: Full scripts
These are all Python scripts.
- macOS / Linux: Save as
~/.claude/statusline.pyand make it executable withchmod +x. - Windows: Save as
~/.claude/statusline.py(no executable bit needed).
Pattern 1: Minimal Dots
#!/usr/bin/env python3
"""Pattern 1: Minimal dots - colored circles with numbers only"""
import json, sys
if sys.platform == 'win32':
sys.stdout.reconfigure(encoding='utf-8')
data = json.load(sys.stdin)
R = '\033[0m'
DIM = '\033[2m'
BOLD = '\033[1m'
def gradient(pct):
if pct < 50:
r = int(pct * 5.1)
return f'\033[38;2;{r};200;80m'
else:
g = int(200 - (pct - 50) * 4)
return f'\033[38;2;255;{max(g, 0)};60m'
def dot(pct):
p = round(pct)
return f'{gradient(pct)}●{R} {BOLD}{p}%{R}'
model = data.get('model', {}).get('display_name', 'Claude')
parts = [f'{BOLD}{model}{R}']
ctx = data.get('context_window', {}).get('used_percentage')
if ctx is not None:
parts.append(f'ctx {dot(ctx)}')
five = data.get('rate_limits', {}).get('five_hour', {}).get('used_percentage')
if five is not None:
parts.append(f'5h {dot(five)}')
week = data.get('rate_limits', {}).get('seven_day', {}).get('used_percentage')
if week is not None:
parts.append(f'7d {dot(week)}')
print(f' {DIM}·{R} '.join(parts), end='')
Pattern 2: Sparkline Gauge
#!/usr/bin/env python3
"""Pattern 2: Sparkline gauge - vertical block characters"""
import json, sys
if sys.platform == 'win32':
sys.stdout.reconfigure(encoding='utf-8')
data = json.load(sys.stdin)
SPARKS = ' ▁▂▃▄▅▆▇█'
R = '\033[0m'
DIM = '\033[2m'
def gradient(pct):
if pct < 50:
r = int(pct * 5.1)
return f'\033[38;2;{r};200;80m'
else:
g = int(200 - (pct - 50) * 4)
return f'\033[38;2;255;{max(g, 0)};60m'
def spark_gauge(pct, width=8):
pct = min(max(pct, 0), 100)
level = pct / 100
gauge = ''
for i in range(width):
seg_start = i / width
seg_end = (i + 1) / width
if level >= seg_end:
gauge += SPARKS[8]
elif level <= seg_start:
gauge += SPARKS[0]
else:
frac = (level - seg_start) / (seg_end - seg_start)
gauge += SPARKS[int(frac * 8)]
return gauge
def fmt(label, pct):
p = round(pct)
return f'{DIM}{label}{R} {gradient(pct)}{spark_gauge(pct)}{R} {p}%'
model = data.get('model', {}).get('display_name', 'Claude')
parts = [model]
ctx = data.get('context_window', {}).get('used_percentage')
if ctx is not None:
parts.append(fmt('ctx', ctx))
five = data.get('rate_limits', {}).get('five_hour', {}).get('used_percentage')
if five is not None:
parts.append(fmt('5h', five))
week = data.get('rate_limits', {}).get('seven_day', {}).get('used_percentage')
if week is not None:
parts.append(fmt('7d', week))
print(f' {DIM}│{R} '.join(parts), end='')
Pattern 3: Ring Meter
#!/usr/bin/env python3
"""Pattern 3: Ring meter - pie-like circle segments"""
import json, sys
if sys.platform == 'win32':
sys.stdout.reconfigure(encoding='utf-8')
data = json.load(sys.stdin)
R = '\033[0m'
DIM = '\033[2m'
BOLD = '\033[1m'
RINGS = ['○', '◔', '◑', '◕', '●']
def gradient(pct):
if pct < 50:
r = int(pct * 5.1)
return f'\033[38;2;{r};200;80m'
else:
g = int(200 - (pct - 50) * 4)
return f'\033[38;2;255;{max(g, 0)};60m'
def ring(pct):
idx = min(int(pct / 25), 4)
return RINGS[idx]
def fmt(label, pct):
p = round(pct)
return f'{DIM}{label}{R} {gradient(pct)}{ring(pct)} {p}%{R}'
model = data.get('model', {}).get('display_name', 'Claude')
parts = [f'{BOLD}{model}{R}']
ctx = data.get('context_window', {}).get('used_percentage')
if ctx is not None:
parts.append(fmt('ctx', ctx))
five = data.get('rate_limits', {}).get('five_hour', {}).get('used_percentage')
if five is not None:
parts.append(fmt('5h', five))
week = data.get('rate_limits', {}).get('seven_day', {}).get('used_percentage')
if week is not None:
parts.append(fmt('7d', week))
print(' '.join(parts), end='')
Pattern 4: Fine Bar + Gradient
#!/usr/bin/env python3
"""Pattern 4: Fine-grained progress bar with true color gradient"""
import json, sys
if sys.platform == 'win32':
sys.stdout.reconfigure(encoding='utf-8')
data = json.load(sys.stdin)
BLOCKS = ' ▏▎▍▌▋▊▉█'
R = '\033[0m'
DIM = '\033[2m'
def gradient(pct):
if pct < 50:
r = int(pct * 5.1)
return f'\033[38;2;{r};200;80m'
else:
g = int(200 - (pct - 50) * 4)
return f'\033[38;2;255;{max(g,0)};60m'
def bar(pct, width=10):
pct = min(max(pct, 0), 100)
filled = pct * width / 100
full = int(filled)
frac = int((filled - full) * 8)
b = '█' * full
if full < width:
b += BLOCKS[frac]
b += '░' * (width - full - 1)
return b
def fmt(label, pct):
p = round(pct)
return f'{label} {gradient(pct)}{bar(pct)} {p}%{R}'
model = data.get('model', {}).get('display_name', 'Claude')
parts = [model]
ctx = data.get('context_window', {}).get('used_percentage')
if ctx is not None:
parts.append(fmt('ctx', ctx))
five = data.get('rate_limits', {}).get('five_hour', {}).get('used_percentage')
if five is not None:
parts.append(fmt('5h', five))
week = data.get('rate_limits', {}).get('seven_day', {}).get('used_percentage')
if week is not None:
parts.append(fmt('7d', week))
print(f'{DIM}│{R}'.join(f' {p} ' for p in parts), end='')
Pattern 5: Braille Dots
#!/usr/bin/env python3
"""Pattern 5: Braille dots - dotted progress bar using braille characters"""
import json, sys
if sys.platform == 'win32':
sys.stdout.reconfigure(encoding='utf-8')
data = json.load(sys.stdin)
BRAILLE = ' ⣀⣄⣤⣦⣶⣷⣿'
R = '\033[0m'
DIM = '\033[2m'
def gradient(pct):
if pct < 50:
r = int(pct * 5.1)
return f'\033[38;2;{r};200;80m'
else:
g = int(200 - (pct - 50) * 4)
return f'\033[38;2;255;{max(g, 0)};60m'
def braille_bar(pct, width=8):
pct = min(max(pct, 0), 100)
level = pct / 100
bar = ''
for i in range(width):
seg_start = i / width
seg_end = (i + 1) / width
if level >= seg_end:
bar += BRAILLE[7]
elif level <= seg_start:
bar += BRAILLE[0]
else:
frac = (level - seg_start) / (seg_end - seg_start)
bar += BRAILLE[min(int(frac * 7), 7)]
return bar
def fmt(label, pct):
p = round(pct)
return f'{DIM}{label}{R} {gradient(pct)}{braille_bar(pct)}{R} {p}%'
model = data.get('model', {}).get('display_name', 'Claude')
parts = [model]
ctx = data.get('context_window', {}).get('used_percentage')
if ctx is not None:
parts.append(fmt('ctx', ctx))
five = data.get('rate_limits', {}).get('five_hour', {}).get('used_percentage')
if five is not None:
parts.append(fmt('5h', five))
week = data.get('rate_limits', {}).get('seven_day', {}).get('used_percentage')
if week is not None:
parts.append(fmt('7d', week))
print(f' {DIM}│{R} '.join(parts), end='')